Web Administration
Tracking, Map & Reports
Live oversight from the office: project-wise installation map, per-QR chain-of-custody history, and filtered stock and progress reports.
Project-Wise Installation Map
Every geo-tagged installation plotted on a live map.
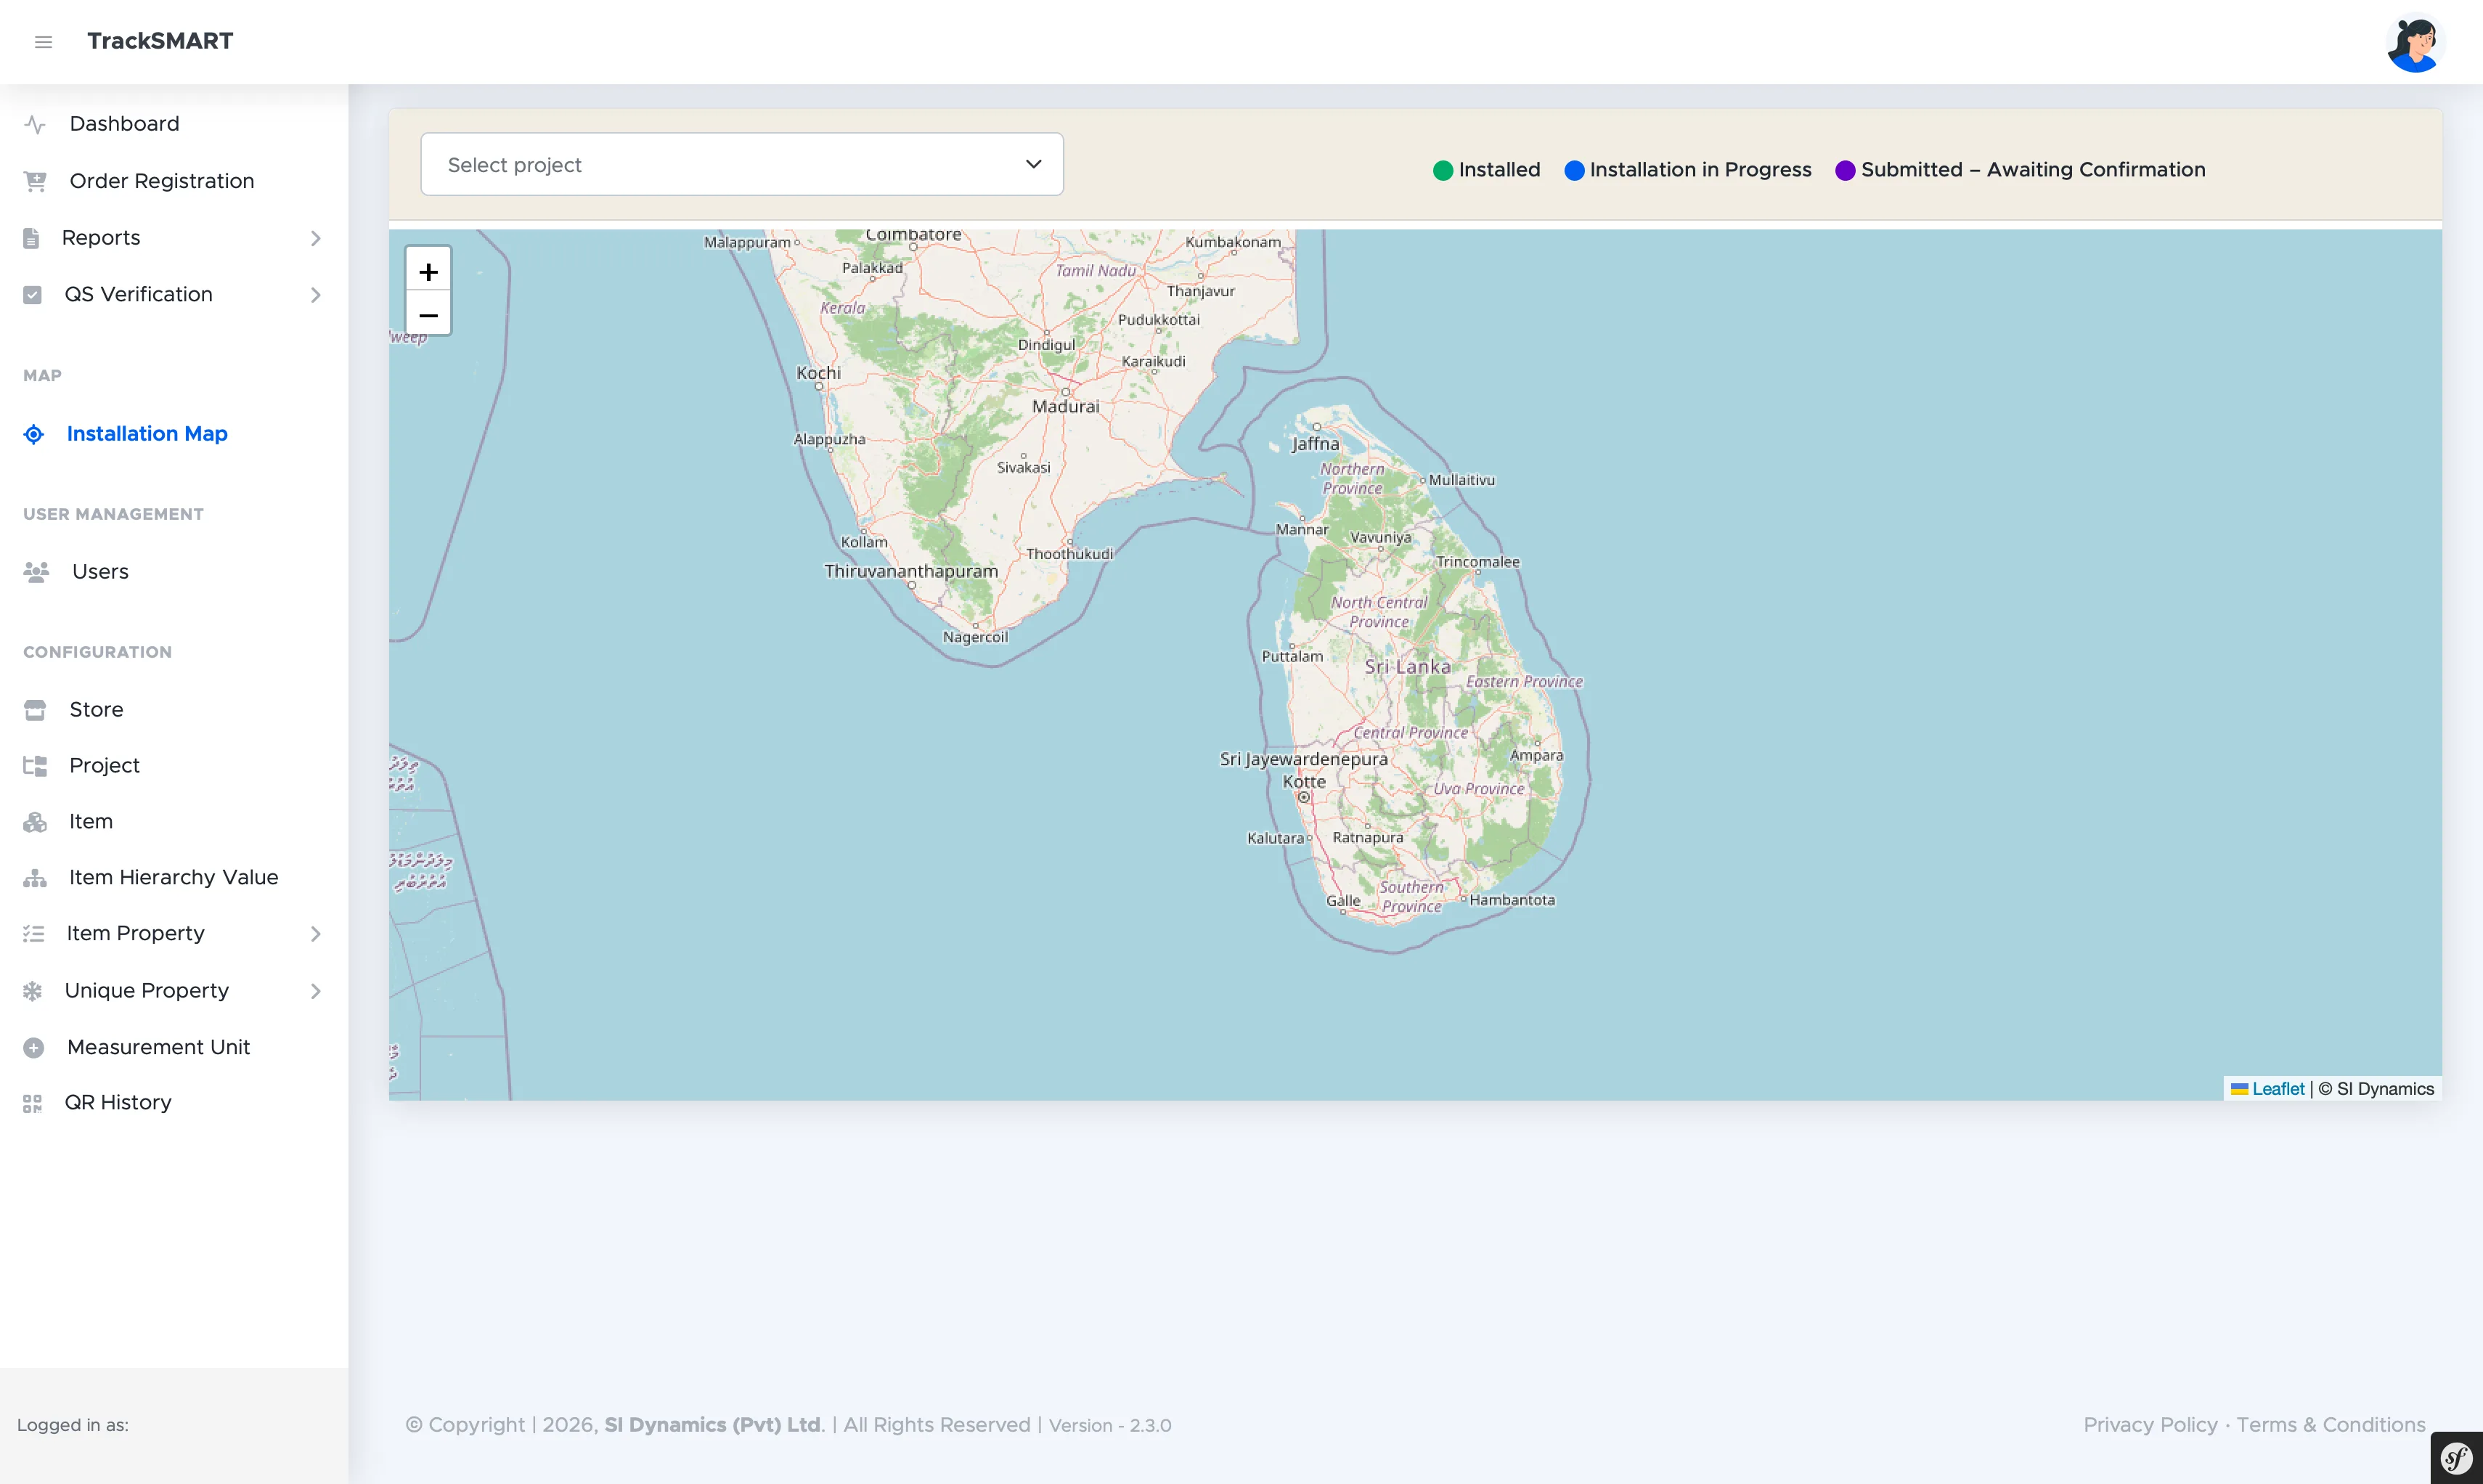
Installation Map (MAP section) renders all supervisor-recorded GPS positions on a Leaflet map. Pick a project from the selector and read status straight off the legend: Installed, Installation in Progress, or Submitted – Awaiting Confirmation.
QR History & Chain of Custody
The full journey of any serialized asset.
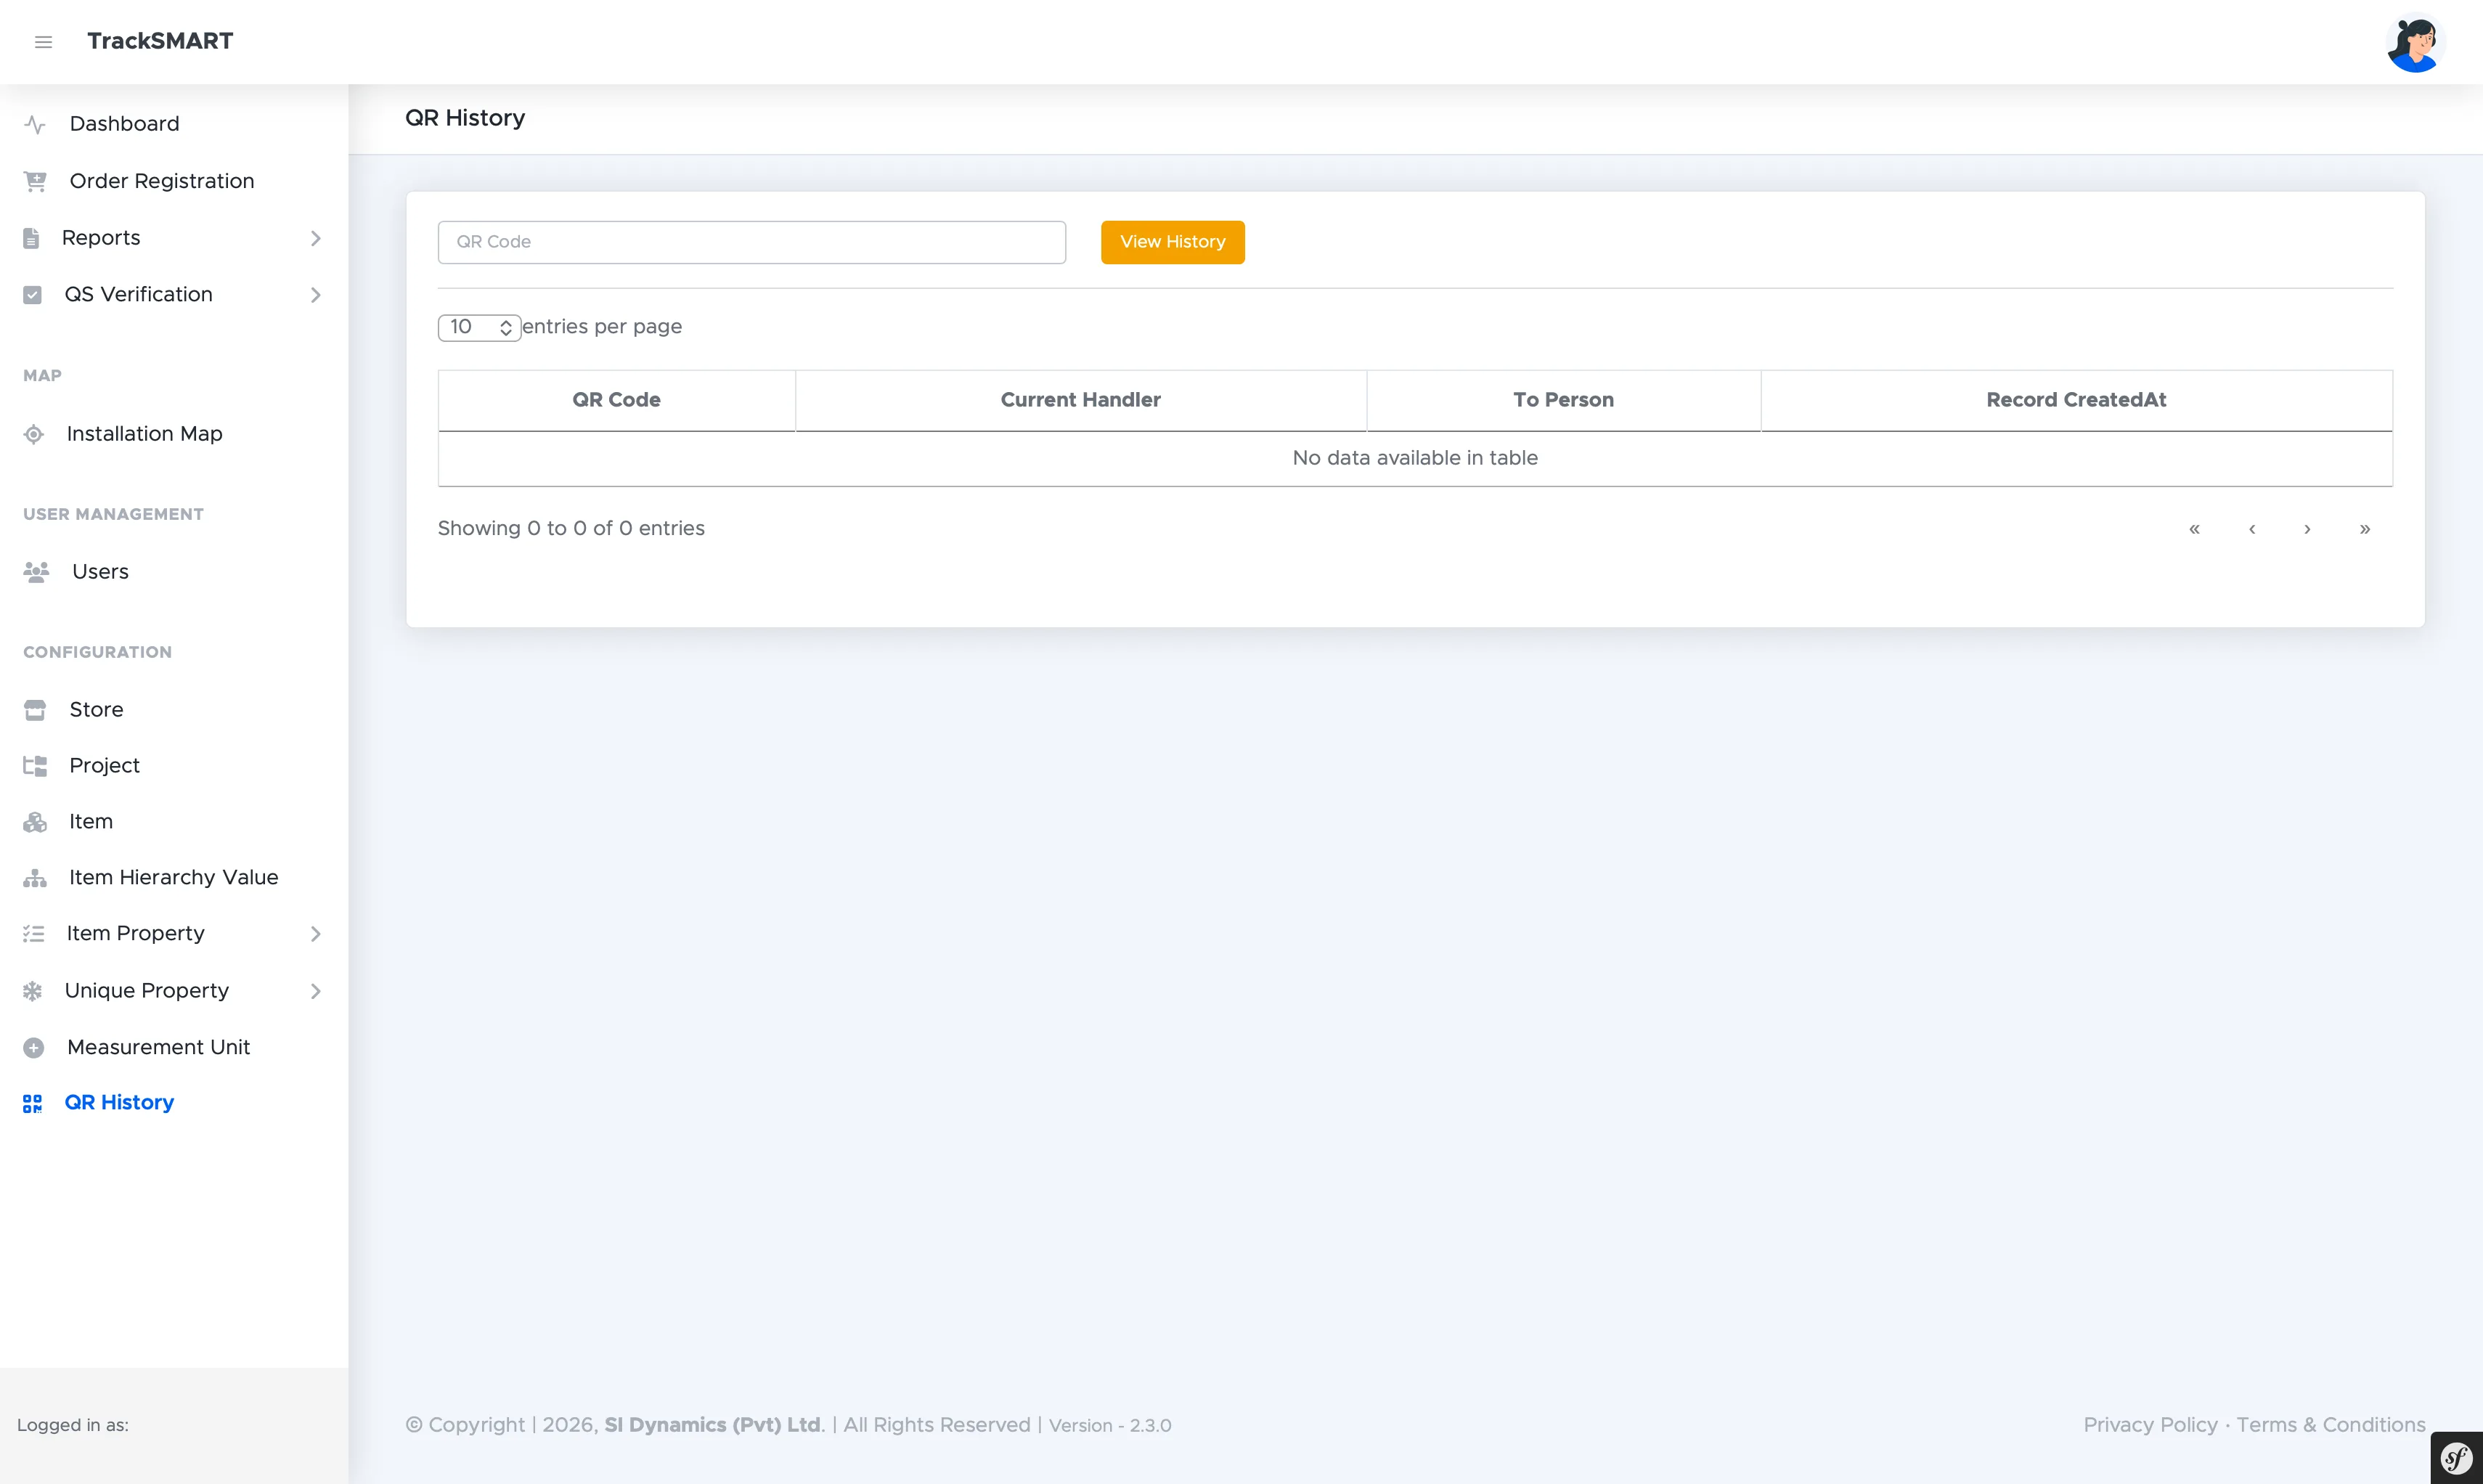
QR History (CONFIGURATION > QR History) answers who had an asset and when. Enter a QR code, click View History, and the table reconstructs every handover: the QR code, the Current Handler, the person it moved To, and the Record CreatedAt timestamp for each hop.
Viewing Reports
Filtered stock and progress reporting with download.
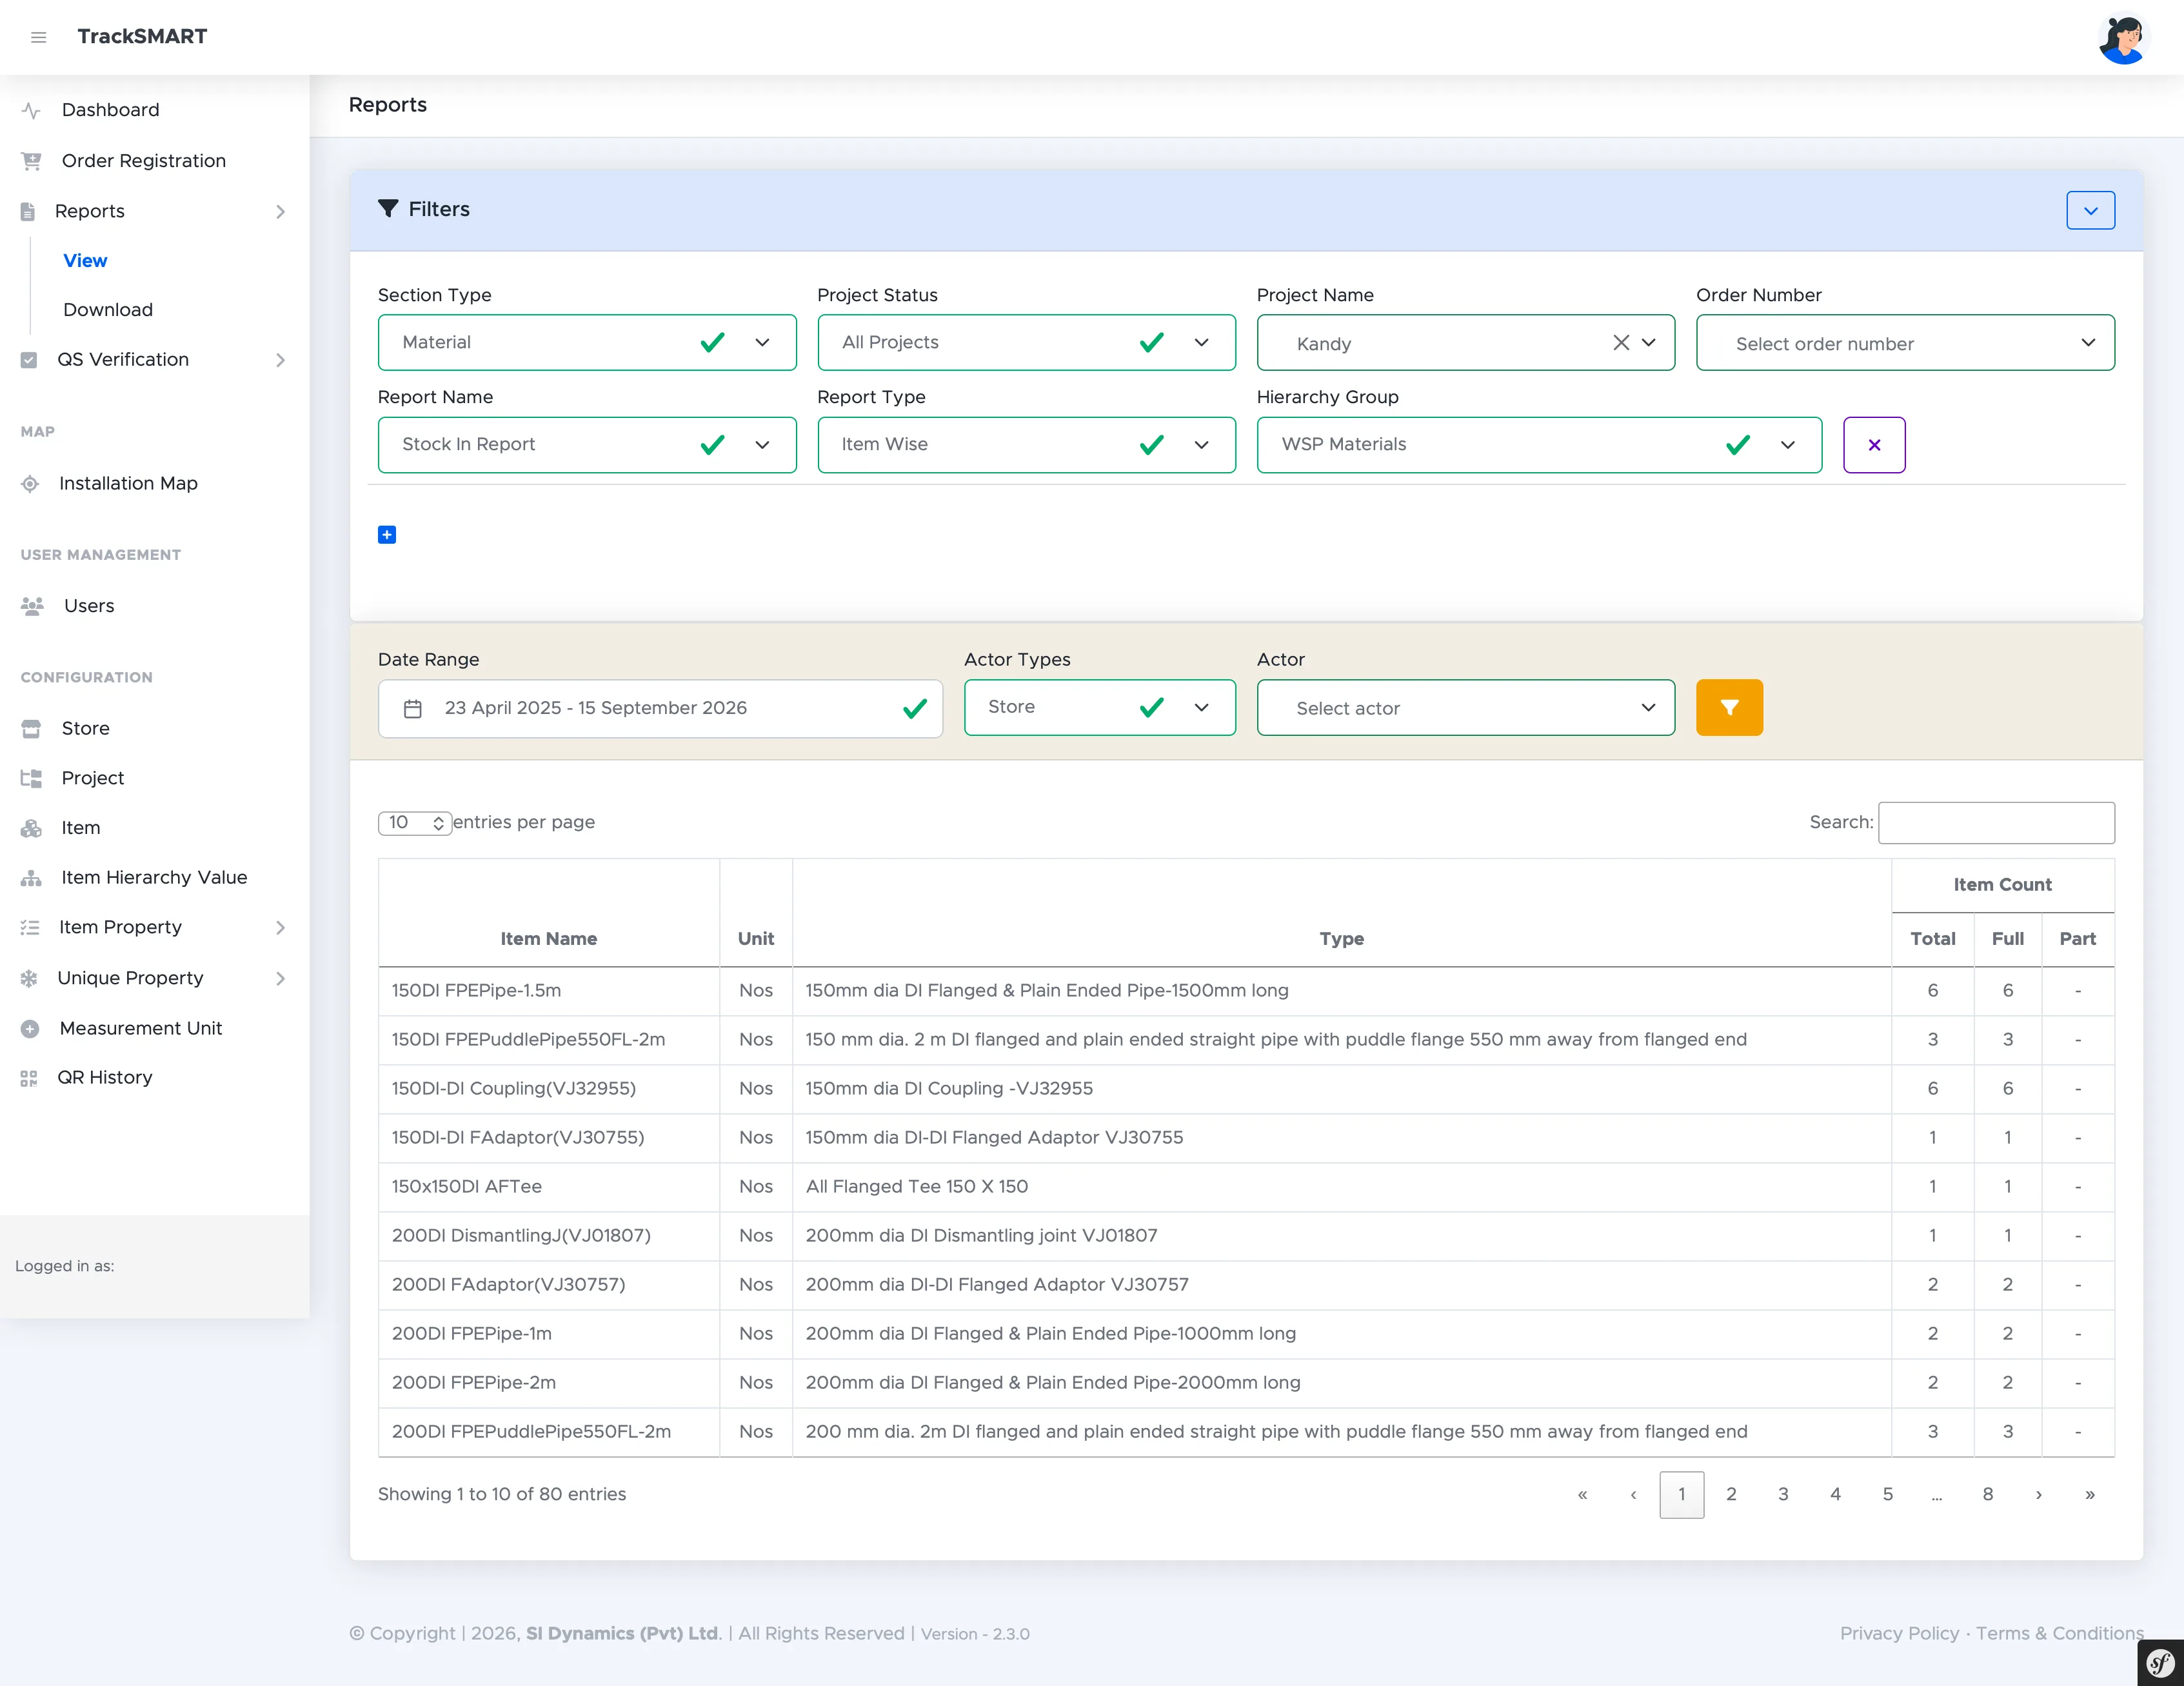
Reports > View is the analytical core: two filter bands narrow any question. The top band fixes scope (Section Type, Project Status, Project Name, Order Number, Report Name such as Stock In Report, Report Type such as Item Wise, Hierarchy Group). The second band fixes time and actor (Date Range, Actor Types such as Store, and Actor). Results tabulate Item Name, Unit, Type, and Item Count split into Total, Full, and Part columns.